Table of Contents
Summary
Introduced within TMOS 11.0, AVR (Application Visibility and Reporting) allows you to gather statistics on the performance of applications, such as pool members, virtual servers etc.
From within these statistics, analytics such as latency, response times and throughput (to name but a few) can then be viewed either via either the WebUI or the TMSH (Traffic Management Shell).
Provisioning
AVR is a module that is included as one of the core modules within v11.0. Meaning that you will not need to purchase an additional license. When provisioning (‘System / Resource’ within the GUI) it is recommended to select a resource setting of ‘Minimal’. This is to ensure that should the resources of your box come under heavy use your primary modules that are provisioned as ‘Nominal’ are prioritized.
Usage
Enable
To enable Analytics, create a new profile within ‘Local Traffic’ / ‘Profiles’ / Analytics. From within this profile you can then also set which virtual servers you want to enable it on.
Display
As previously mentioned. The statistics can be viewed from both the Web UI and also TMSH.
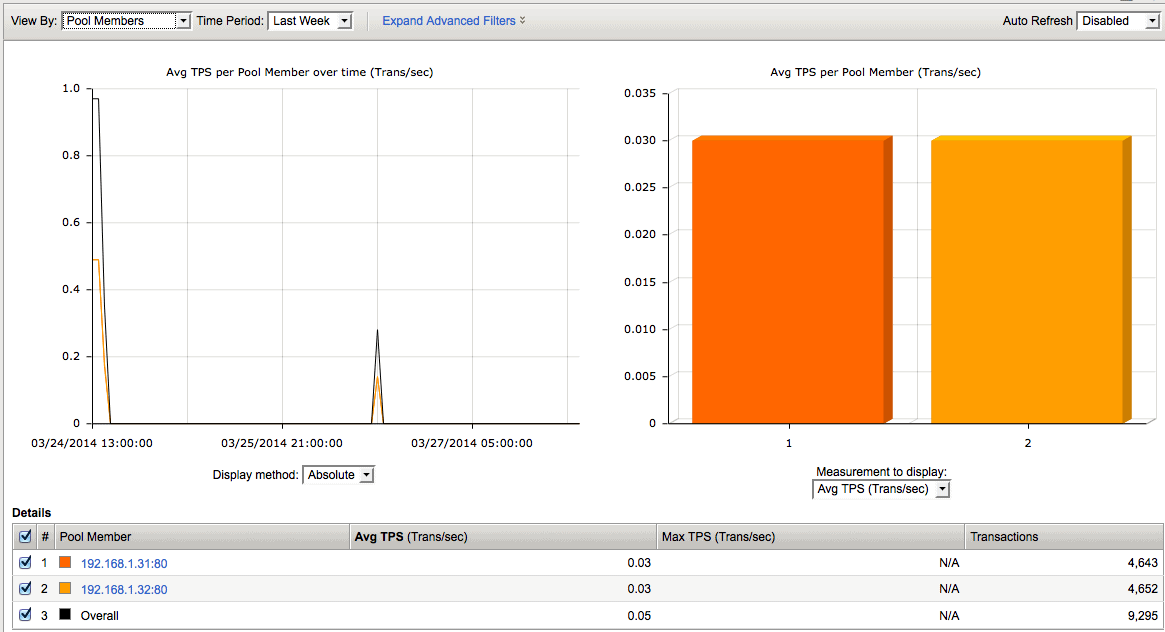
WebUI – To view the stats from the Web UI, go into the ‘Virtual Server / Statistics / Analytics’.
TMSH – To see the stats from TMSH the command ‘show analytics ….’ is used.
root@(f5v114-ltm0)(cfg-sync In Sync)(Active)(/Common)(tmos)# show analytics http report view-by
pool-member range now-3d measures { average-server-latency }
----------------------------------------
Analytics query result
----------------------------------------
Time range: 03/24/2014:23:39 ---> now
----------------------------------------
name            | average-server-latency
----------------------------------------
192.168.1.31:80 | 5.66
192.168.1.32:80 | 5.54

root@(f5v114-ltm0)(cfg-sync In Sync)(Active)(/Common)(tmos)# show analytics http report view-by
url range 2014-12-22:15:00:00--2014-12-22:17:00:00 measures { transactions max-server-latency a
verage-server-latency } limit 50 drilldown {{ entity virtual values { /Common/VS-1.1.1.1-443 }
 } } order-by { { measure max-server-latency sort-type desc } }
-----------------------------------------------------------------------------
Analytics query result
-----------------------------------------------------------------------------
Time range: 12/22/2014:15:00 (GMT) ---> 12/22/2014:17:00 (GMT)
------------------------------------------------------------------------------
name              | transactions | max-server-latency | average-server-latency
------------------------------------------------------------------------------
/example/         | 90           | 560.00             | 86.20
/anotherexample   | 16           | 429.00             | 129.38
Note : You will also see a profile called ‘Statistics’. However the ‘Statistics’ profile has no correlation to AVR, but instead is used in conjunction with iStats to record statistics from within an iRule.

- NETCONF & YANG: Automate Network Configs via Python - April 2, 2026
- Palo Alto – How to Configure Your Next-Generation Firewall - April 2, 2026
- How to Harden Linux SSH: Keys, Fail2ban & Ciphers - March 1, 2026
Want to become a Loadbalancers expert ?
Here is our hand-picked selection of the best courses you can find online:
F5 BIG-IP 101 Certification Exam – Complete Course
F5 BIG-IP 201 Certification Exam – Complete Course
and our recommended certification practice exams:
Delta Practice Tests