A monitor is a test that the LTM can perform on either a node of member. A monitor typically tests for a specific response within a specified time period. BigIP uses the results of this to decide on whether traffic should be sent to the node or pool member.
Table of Contents
Types of Monitoring
There 4 main types of monitoring:
- Address Check – IP address (Node)
- Service Check – IP : port
- Content Check – IP : port & check data returned
- Interactive Check – Interactive with servers. Multiple commands and multiple responses.
Address Check
This is the simplest type of check. An example of an address check is ICMP. This is used to ping an IP address and if there is no response within the specified time period the node is marked as down.
Service Check
Rather then just checking the IP Service Checks monitors the port. This is achieved by issuing a layer 4 connection to the node. The connection is opened and closed. If connection fails, the member is marked as as down and no traffic is distributed to the particular node.
Content Check
Content Checks check whether the server is also serving the correct content. Once the TCP connection is opened, a command is sent (such as a HTTP GET) and the response is examined and the connection closed. If the connection fails or the received string is not obtained the member is marked as down and no further connections are sent to the member.
Note : It is important that the receive string is not configured using a string that may be also used with any error pages (such as a 404 page), as this would prevent the monitor from correctly marking the the member as offline.
Interactive Check
Protocols such as FTP require interactive checks as additional commands such as username, password and directory are typically required.
Typically Interactive Checks consist of a TCP connection that is opened, command(s) are then sent, the responses examined and the connection closed.
If any condition fails the member is marked as down and no further connections are sent to the member.
Note : Most interactive checks are external monitors. External monitors external scripts (perl, shell etc) that the LTM calls to perform the required tests (and to aggregate the results).
Below describes the various interactive checks available:
Scripted Monitors – Scripted Monitors use the Expect method/”model” (send/expect) to determine a nodes health. Expect is a UNIX binary that sends a command and then expects are specific response back.
External Monitors – External Monitors are custom shell scripts that can be created to determine the health of a node.
Performance Monitors – As the name suggests Performance monitors deem the nodes health by querying the nodes performance. There are a number of methods in which this can be achieved. These are :
– Dynamic Ratio LoadBalancing – Dynamic Ratio Load-Balancing queries the given agent on either a RealNetwork RealServer, WMI or SNMP based platform to determine a ratio value. This ratio value is then dynamically assigned to the node.
– SNMP DCA – SNMP DCA determines performance via the data collected from the nodes SNMP agent.
– SNMP DCA Base – SNMP DCA determines performance via only the user-data collected from the nodes SNMP agent.
– WMI – WMI determines performance via the data collected from the nodes WMI agent.
Miscellaneous
Inband Passive Monitor – Rather than issue a connection to the server to determine its health, Inband Passive Monitors determine the health of the node by the monitoring of actual traffic being sent to and from the node. The main benefit of this monitor is that it requires little system resource. However as Passive monitors can also be slow to bring pools members back online it is recommended that they are used in conjunction with Active Monitors via the use of the Active Monitor option “Check Until Up”.
Creating Custom Monitors
Below shows the steps required to create a custom monitor:
- Go to ‘Local Traffic | Monitors | Create’.
- Add the Name and select a template from the Type drop down menu.
- Then define the Interval and Timeout.
Note :
Interval – Interval between checks.
Timeout – Defines how long F5 should wait before marking a node/member as down.
Recommended Setting – Timeout = (3 x Interval) + 1 sec.
Associating a Monitor
Nodes
To assign a monitor :
- Default : Go to ‘Local Traffic | Nodes | Default Monitor’ then define the active health monitor.
- Single Node : To set a monitor to one node go to ‘Local Traffic | Nodes | Node List’ and select the node. Then from the Health Monitor drop down select the monitor.
Pool
To assign a monitor to a pool.
- Go to ‘Local Traffic | Pools’ and select the pool.
- Within the configuration screen select the Health Monitor.
Pool Member
- Go to ‘Traffic | Pools’ and select the Pool.
- Then select the individual member.
- Within the Configuration screen select Advanced.
- Under Health Monitor select Member Specific and then select the necessary monitor.
Status due to monitors
Types
There are 4 main status types (with regards to monitors). These are :
- Up / Available – Means the most recent monitor check was successful.
- Down / Offline – Means no response equal to the configured timeout period.
- Unknown – Typically means no monitor is assigned nor the monitor has yet to return a result.
- Connection Limit / Unavailable – Previously defined connection limit has been reached. In turn no traffic is sent.
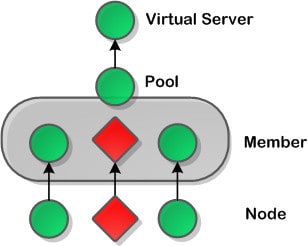
Inheritance
The status of each monitor is inherited from its children.
If a node is marked offline, then the member is marked offline. As long as there are other members still online in the pool the Pool would still be marked as up.

- NETCONF & YANG: Automate Network Configs via Python - April 2, 2026
- Palo Alto – How to Configure Your Next-Generation Firewall - April 2, 2026
- How to Harden Linux SSH: Keys, Fail2ban & Ciphers - March 1, 2026
Want to become a Loadbalancers expert ?
Here is our hand-picked selection of the best courses you can find online:
F5 BIG-IP 101 Certification Exam – Complete Course
F5 BIG-IP 201 Certification Exam – Complete Course
and our recommended certification practice exams:
Delta Practice Tests