Wireshark provides the ability to calculate the amount of time between packets. This data can then be used within the IO graphing tool of Wireshark to create a visual representation which can be used when troubleshooting networking issues.
Within this article we will show you how to create the TCP delta column, the TCP preferences involved and then how to graph this data.
TCP Delta Column
To create the column. The following steps are preformed,
- Select ‘View / Time Display Format / Seconds Since Previous Displayed Packet‘
- Right click on TCP packet. Select ‘Protocol Preferences / Calculate Conversation Timestamps‘ (This is to ensure we only show the delta between packets within the same TCP conversation.)
- Within the TCP section of the packet you will now see [TIMESTAMPS].
- Right Click on the line that says ‘Time since previous frame‘ and choose ‘Apply as Column‘.
Graphing
- Goto ‘Statistics’ / ‘IO Graph‘
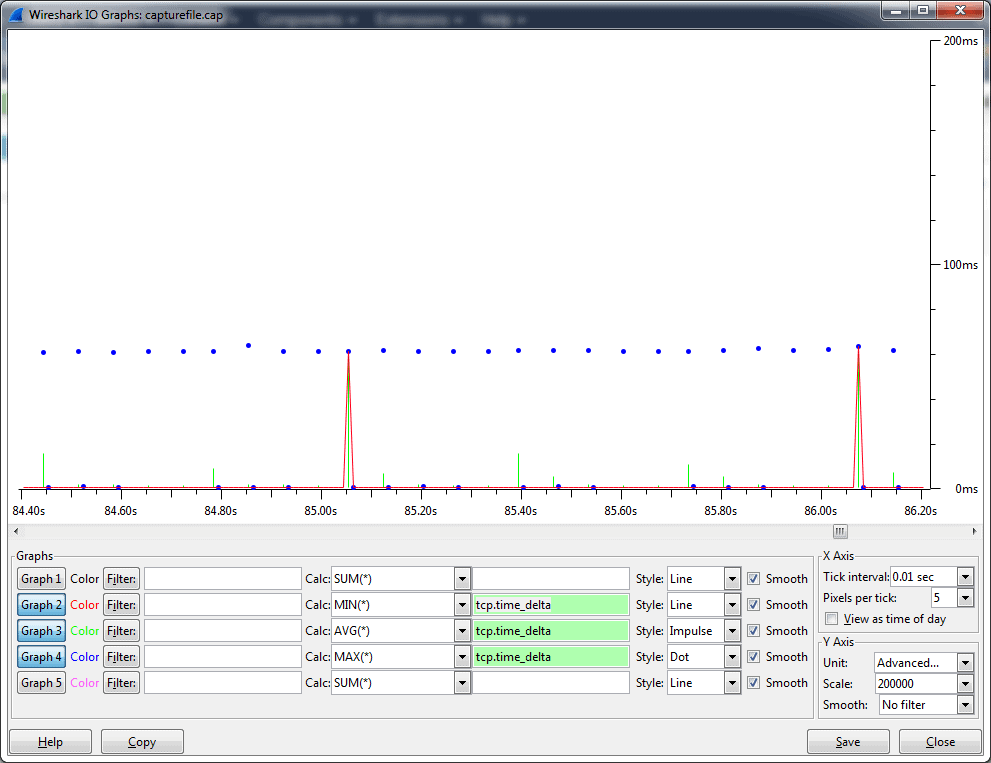
- Within the window set the following.
References
- Details how to create the IO Graph – http://wiresharkbook.com/tr_samplepages/978-1-893939-97-4lab89deltatimes286.pdf
- Video on how to create TCP delta columns – https://www.youtube.com/watch?v=QqKAnZnHss0

Rick Donato is a Network Automation Architect/Evangelist and the founder of Packet Coders.
Latest posts by Rick Donato (see all)
- NETCONF & YANG: Automate Network Configs via Python - April 2, 2026
- Palo Alto – How to Configure Your Next-Generation Firewall - April 2, 2026
- How to Harden Linux SSH: Keys, Fail2ban & Ciphers - March 1, 2026
Want to become a networking expert ?
Here is our hand-picked selection of the best courses you can find online:
Cisco CCNA Certification Gold Bootcamp
Complete Cyber Security Course – Network Security
Internet Security Deep Dive course
Python Pro Bootcamp
and our recommended certification practice exams:
Delta Practice Tests